
At our organisation, we host our online courses using Open edX. While Open edX and other tools like our CRM and issue-tracking platforms provide built-in analytics dashboards, each system only presents a part of the picture. Our team often struggled to quickly gather meaningful insights due to fragmented data sources. We needed a single source of truth to clearly visualize metrics like user acquisition trends, course completion rates, and issue tracking statuses.
Requirements
We established clear requirements for the dashboard solution:
- Ease of setup and iteration: Engineering time is precious; our solution had to be quick to install, configure, and modify.
- Visualization flexibility: It needed to support diverse visualizations without requiring extensive custom coding.
- Compatibility with diverse data sources: We manage multiple databases across platforms like Open edX and our CRM.
- Collaborative and shareable: Easily create dashboards and share insights internally with stakeholders without friction.
Why Metabase?
We explored several solutions including PowerBI and even custom-built React dashboards
We ultimately chose Metabase because:
- Fast Setup: Metabase allowed us to quickly connect to our databases, including those within our VPN, without additional licenses or complex configurations.
- Flexible Visualizations: It offered diverse built-in visualizations without extensive custom development.
- Cost-Effective: The self-hosted option meant our only cost was infrastructure.
- Easy Collaboration: Intuitive dashboard creation and sharing improved internal communication significantly.
How We Used Metabase
We followed a structured workflow:
1. Connecting Data Sources
Metabase seamlessly integrated data from different databases from our Open edX instance and the issue-tracking platforms.
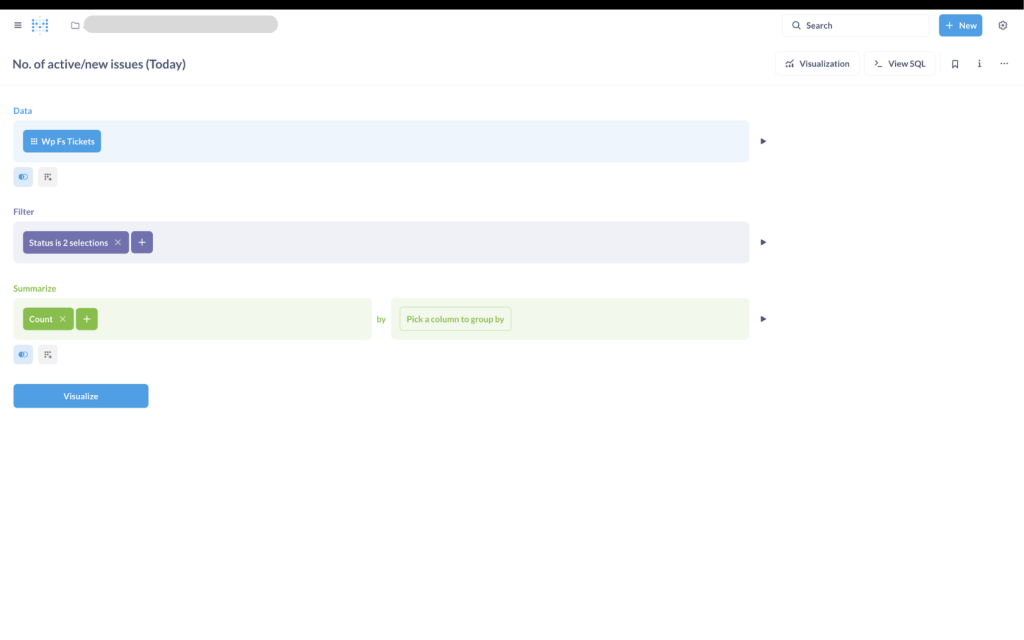
2. Exploring & Understanding Our Dataset
We used built-in filter functions extensively, allowing us to quickly drill down into data for insights. This lets us understand our data and the kind of preprocessing needed to start data analysis.
3. Creating Visualizations
We rapidly developed initial visualizations such as user acquisition patterns, course completion trends, and issue resolution timelines.
Metabase’s versatile tools catered to team members of varying technical expertise. Those proficient in SQL leveraged the SQL editor, while colleagues less familiar with SQL effectively utilized the visual editor. This inclusive capability empowered everyone on the team to contribute meaningfully, regardless of their technical background.
Additionally, we organized our workspace so each engineer had their own personal environment for exploration, alongside a shared workspace where visualizations were consolidated and refined collaboratively.
4. Refactoring for Efficiency
Metabase provided models that allowed us to display precalculated, cleaned, and curated datasets, giving us a strong foundation for analysis. To further streamline our process, I use model to curate an initial dataset from which many other calculations will be derived from. This ensured that any changes made to the data preprocessing step would automatically propagate through all future visualizations and analyses, significantly improving efficiency and consistency.

5. Iterating with Stakeholders
We continuously refined the dashboards based on stakeholder feedback, enabling quick adjustments without significant overhead.

Impact
The final Metabase dashboard became our single source of truth, enabling stakeholders to:
- Easily understand user acquisition and retention.
- Clearly monitor course completion and learner engagement.
- Quickly assess and respond to issues.
This help our stakeholders gained confidence in decision-making, informed by clear and unified data.
Key Takeaways
- Metabase simplified our analytics workflow, reduced engineering overhead, and empowered our stakeholders with actionable insights.
- Its flexibility and ease of use greatly enhanced our internal collaboration and data-driven decision-making processes.
Overall, Metabase empowered us to turn scattered data into actionable insights efficiently. It not only improved our team’s workflow but also helped our stakeholders by enabling informed decisions based on data.
Leave a Reply